RAG Over PDFs with ColNomic Embed Multimodal
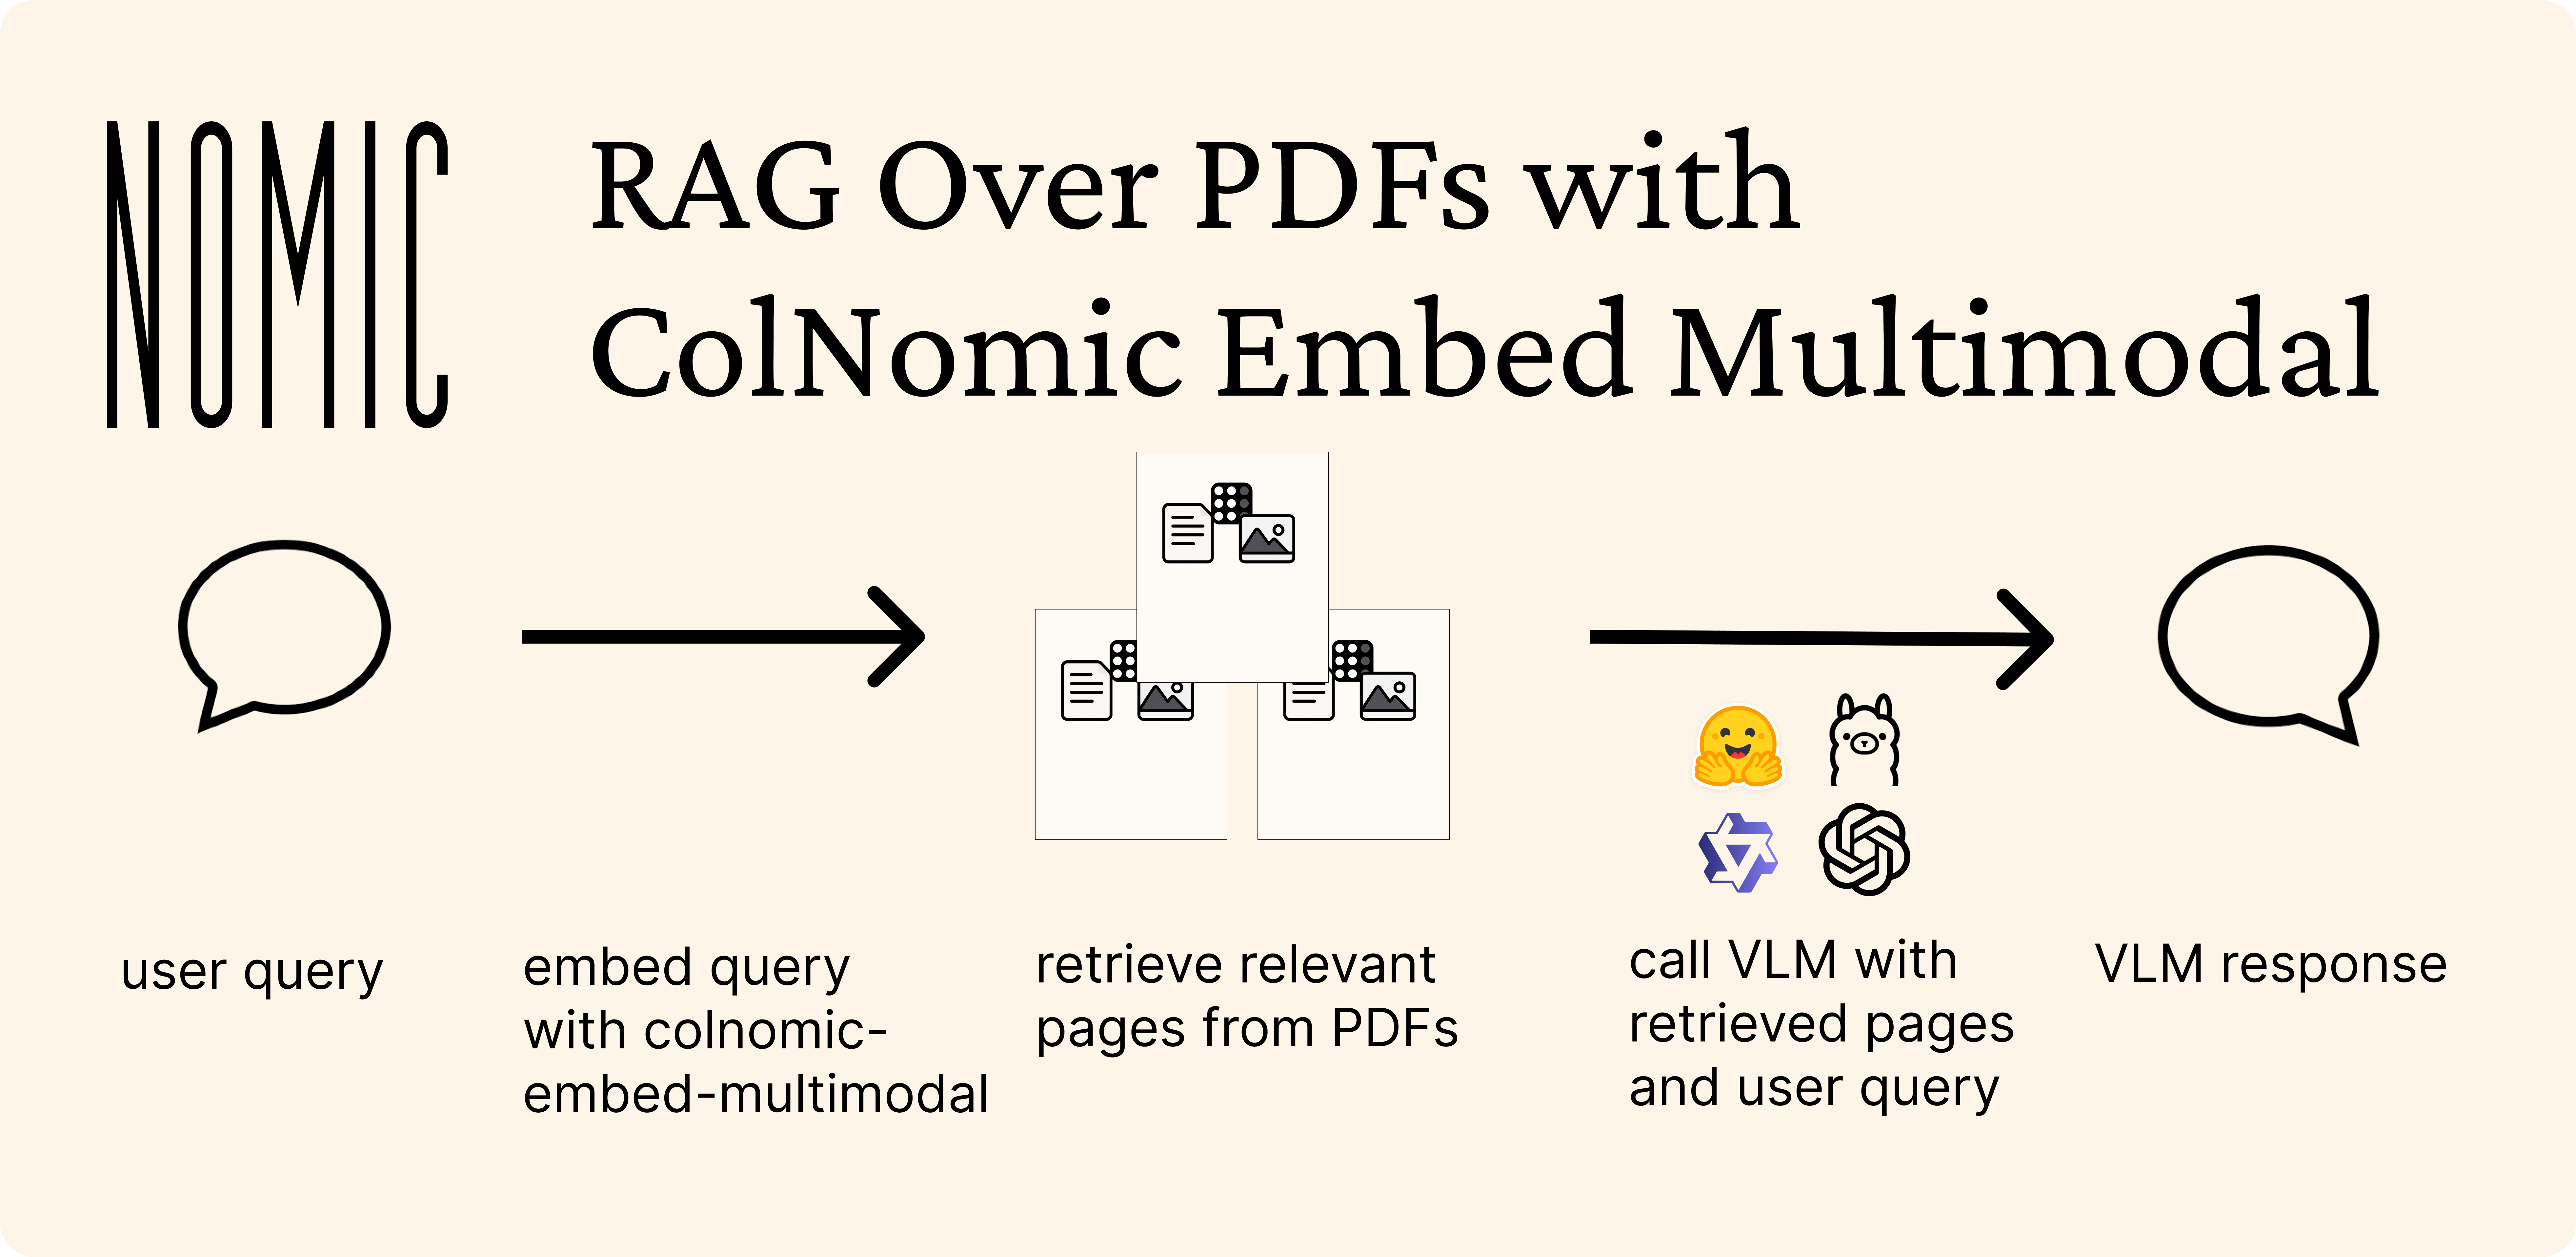
ColNomic Embed Multimodal is a late interaction embedding model that processes both text and images. It can directly process the visual content in PDFs without requiring preprocessing steps like OCR or image captioning.
In this guide, we'll demonstrate how to build multimodal RAG that can answer questions from PDFs containing both text and visual elements.
Installation
This guide requires the Nomic fork of Byaldi for compatibility with the colnomic-embed-multimodal model.
First, let's install the required dependencies, including poppler for PDF to image conversion:
- Linux
- macOS
- Windows
- pip
- uv
pip install -q git+https://github.com/nomic-ai/byaldi.git transformers qwen-vl-utils accelerate flash-attn matplotlib pdf2image pillow
uv pip install -q git+https://github.com/nomic-ai/byaldi.git transformers qwen-vl-utils accelerate flash-attn matplotlib pdf2image pillow
Settup up RAG
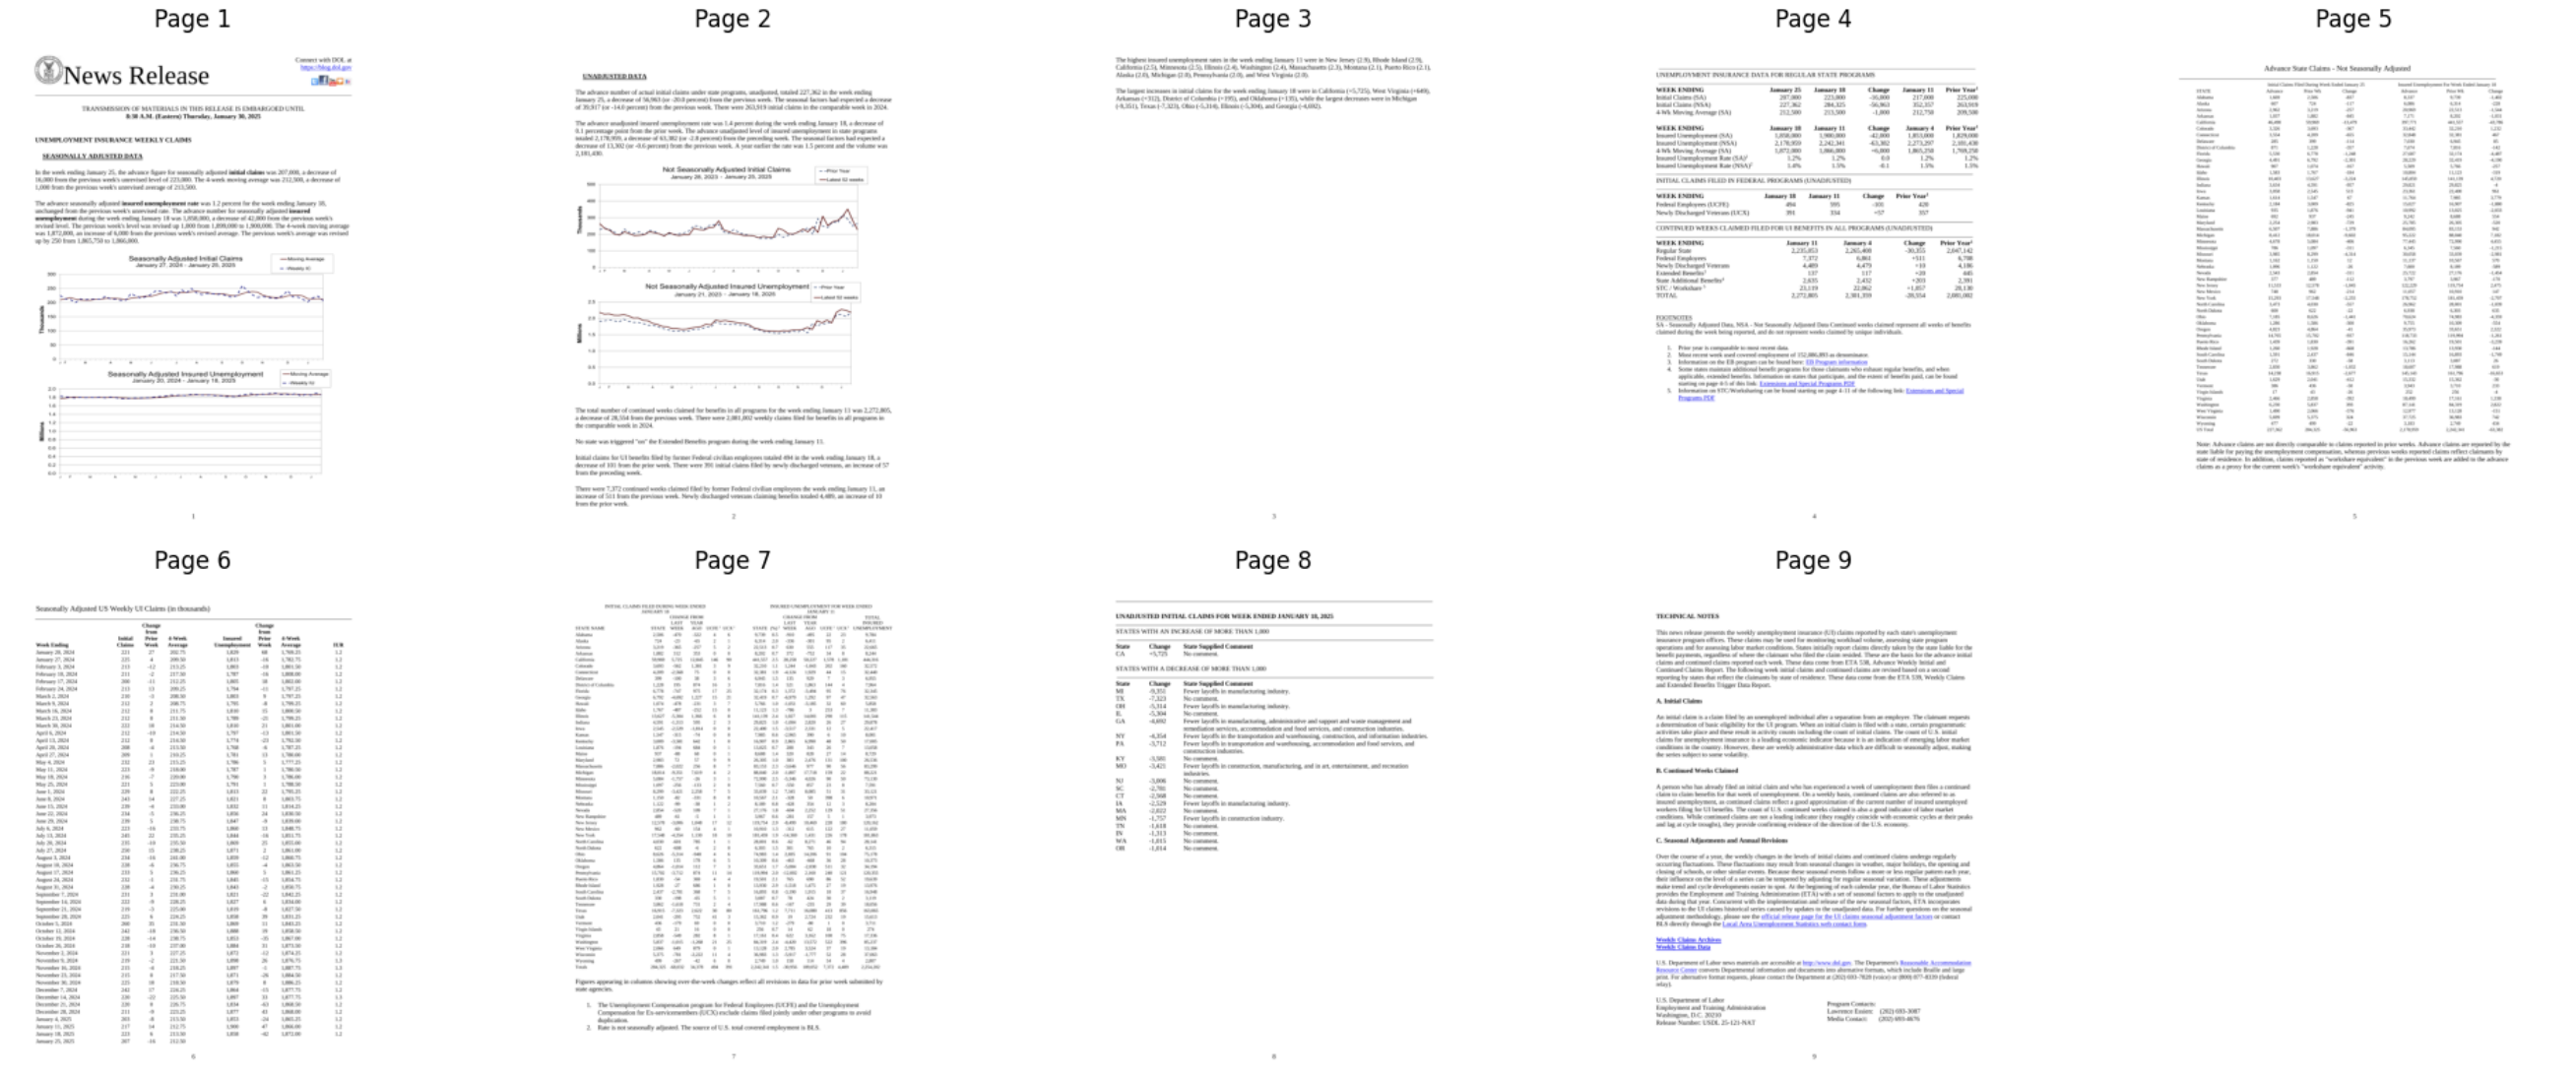
We'll use a sample PDF containing data from the US Department of Labor. You can download it from here.
import matplotlib.pyplot as plt
from pdf2image import convert_from_path

def display_pdf_images(images_list):
    """Display all images in the provided list as subplots with 5 images per row."""
    num_images = len(images_list)
    num_rows = num_images // 5 + (1 if num_images % 5 > 0 else 0)
    fig, axes = plt.subplots(num_rows, 5, figsize=(20, 4 * num_rows))
    axes = axes.flatten()
    for i, img in enumerate(images_list):
        if i < len(axes):
            ax = axes[i]
            ax.imshow(img)
            ax.set_title(f"Page {i+1}")
            ax.axis('off')
    for j in range(num_images, len(axes)):
        axes[j].axis('off')
    plt.tight_layout()
    plt.show()

# Load and display the PDF
pdf_images = convert_from_path("department-of-labor-data.pdf")
display_pdf_images(pdf_images)
We'll use byaldi with colnomic-embed-multimodal as our retriever.
Note: This is much faster on GPU than CPU.
from byaldi import RAGMultiModalModel

# Initialize the model
RAG = RAGMultiModalModel.from_pretrained(
    "nomic-ai/colnomic-embed-multimodal-3b",
    device="cuda:0"
)

RAG.index(
    input_path="department-of-labor-data.pdf",
    index_name="image_index",
    store_collection_with_index=False,
    overwrite=True
)
Setting Up the VLM
We'll use Qwen 2.5 VL 7B Instruct as our vision-language model to answer questions about the retrieved PDF pages:
from transformers import Qwen2_5_VLForConditionalGeneration, AutoProcessor
from qwen_vl_utils import process_vision_info
from PIL.Image import Image

model = Qwen2_5_VLForConditionalGeneration.from_pretrained(
    "Qwen/Qwen2.5-VL-7B-Instruct",
    torch_dtype="auto",
    device_map="auto"
)
processor = AutoProcessor.from_pretrained("Qwen/Qwen2.5-VL-7B-Instruct")

def query_vlm(query: str, images: list[Image]) -> str:
    """Queries Qwen VLM with text and images"""
    system_prompt = "You are an expert professional PDF analyst who gives rigorous in-depth answers."
    message_content = [
        {"type": "image", "image": image}
        for image in images
    ] + [{"type": "text", "text": query}]
    messages = [
        {
            "role": "system",
            "content": [{"type": "text", "text": system_prompt}]
        },
        {
            "role": "user",
            "content": message_content
        }
    ]
    text = processor.apply_chat_template(messages, tokenize=False, add_generation_prompt=True)
    image_inputs, video_inputs = process_vision_info(messages)
    inputs = processor(
        text=[text],
        images=image_inputs,
        videos=video_inputs,
        padding=True,
        return_tensors="pt"
    ).to(model.device)
    generated_ids = model.generate(**inputs, max_new_tokens=1000)
    generated_ids_trimmed = generated_ids[0][len(inputs.input_ids[0]):]
    return processor.decode(generated_ids_trimmed, skip_special_tokens=True)
Example Usage
Single-Document Retrieval
Let's try a query retrieving a single page with k=1:
query = "Which states showed a decrease in unadjusted initial claims the week ending January 18, 2025?"
rag_results = RAG.search(query, k=1)
image = pdf_images[rag_results[0]["page_num"] - 1]
single_doc_answer = query_vlm(query, [image])
print(single_doc_answer)
image and single_doc_answer)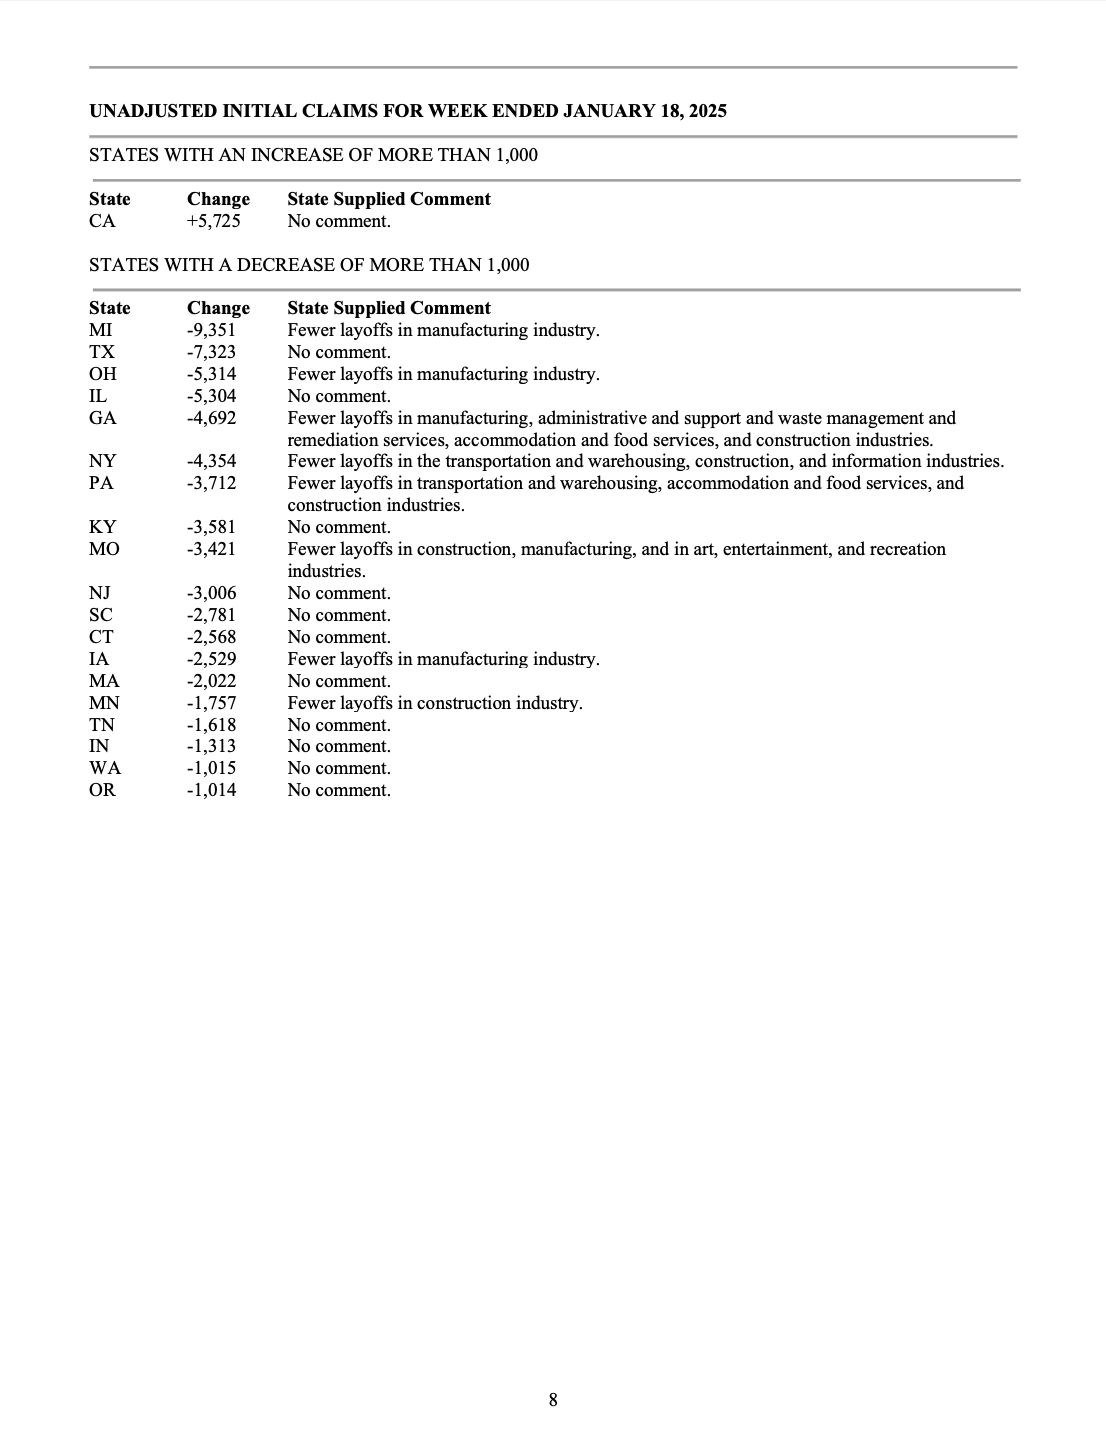
The states that showed a decrease in unadjusted initial claims for the week ending January 18, 2025, were:
- MI (Michigan): -9,351
- TX (Texas): -7,323
- OH (Ohio): -5,314
- IL (Illinois): -5,304
- GA (Georgia): -4,692
- NY (New York): -4,354
- PA (Pennsylvania): -3,712
- KY (Kentucky): -3,581
- MO (Missouri): -3,421
- NJ (New Jersey): -3,006
- SC (South Carolina): -2,781
- CT (Connecticut): -2,568
- IA (Iowa): -2,529
- MA (Massachusetts): -2,022
- MN (Minnesota): -1,757
- TN (Tennessee): -1,618
- IN (Indiana): -1,313
- WA (Washington): -1,015
- OR (Oregon): -1,014
Multi-Document Retrieval
For more complex queries that might require looking at multiple pages:
query = "I want an in-depth report on how charts for seasonally adjusted claims show differences from charts for unadjusted claims."
k = 2
rag_results = RAG.search(query, k=k)
images = [pdf_images[rag_results[i]["page_num"] - 1] for i in range(k)]
multi_doc_answer = query_vlm(query, images)
print(multi_doc_answer)
images and multi_doc_answer)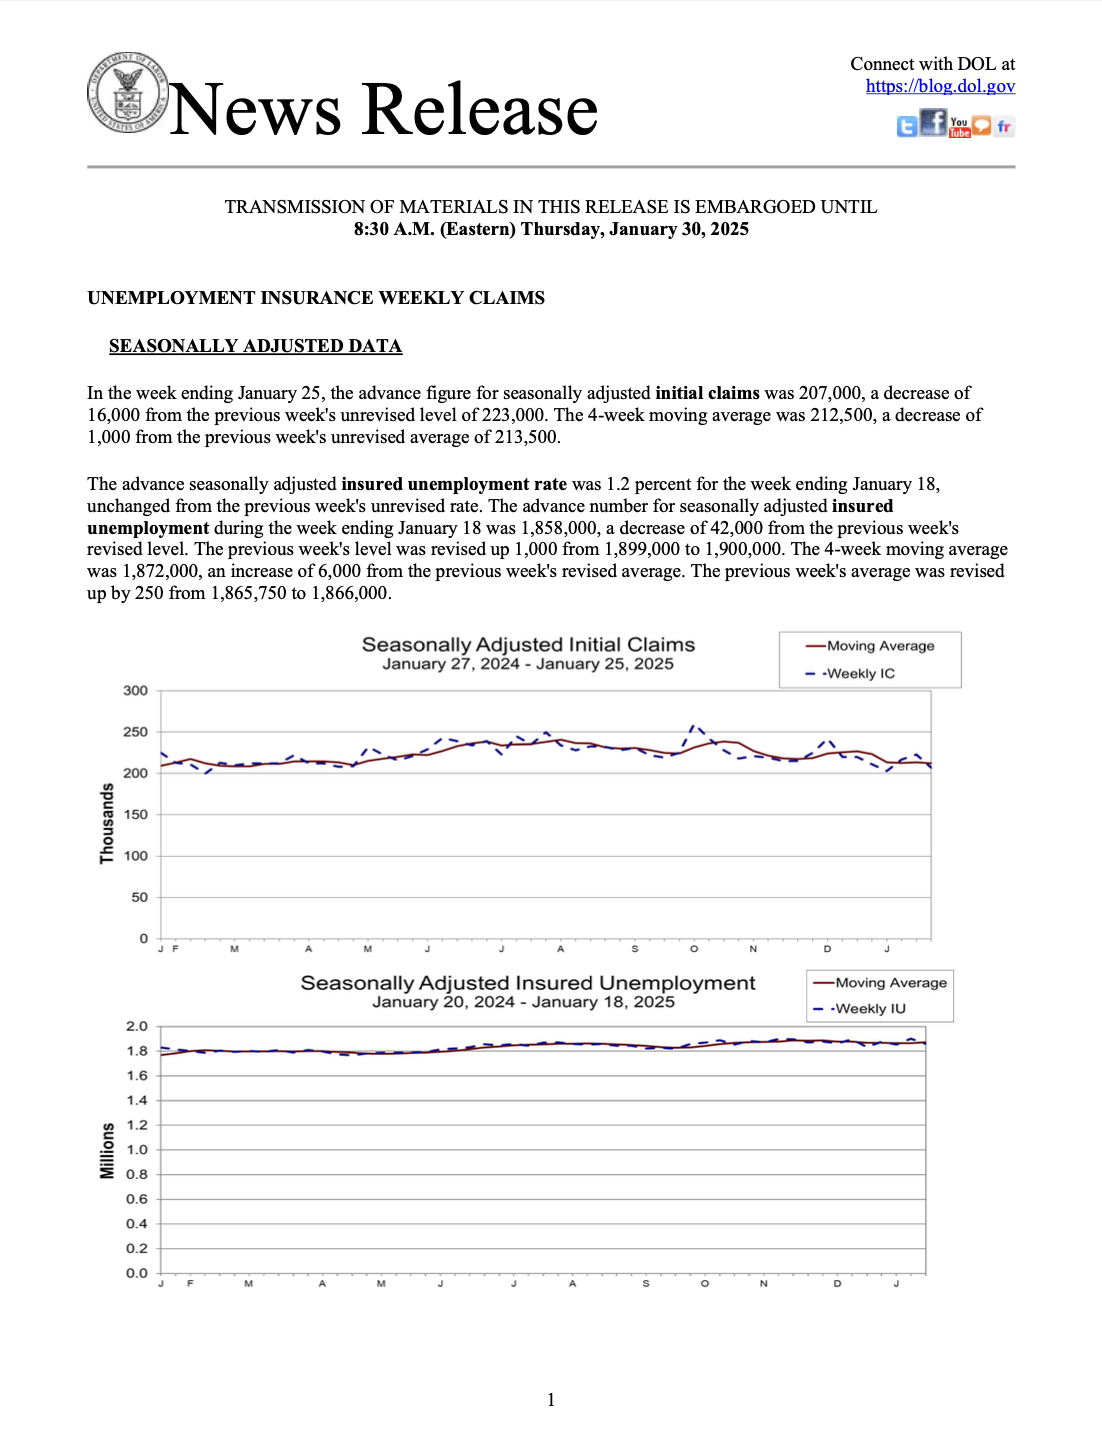
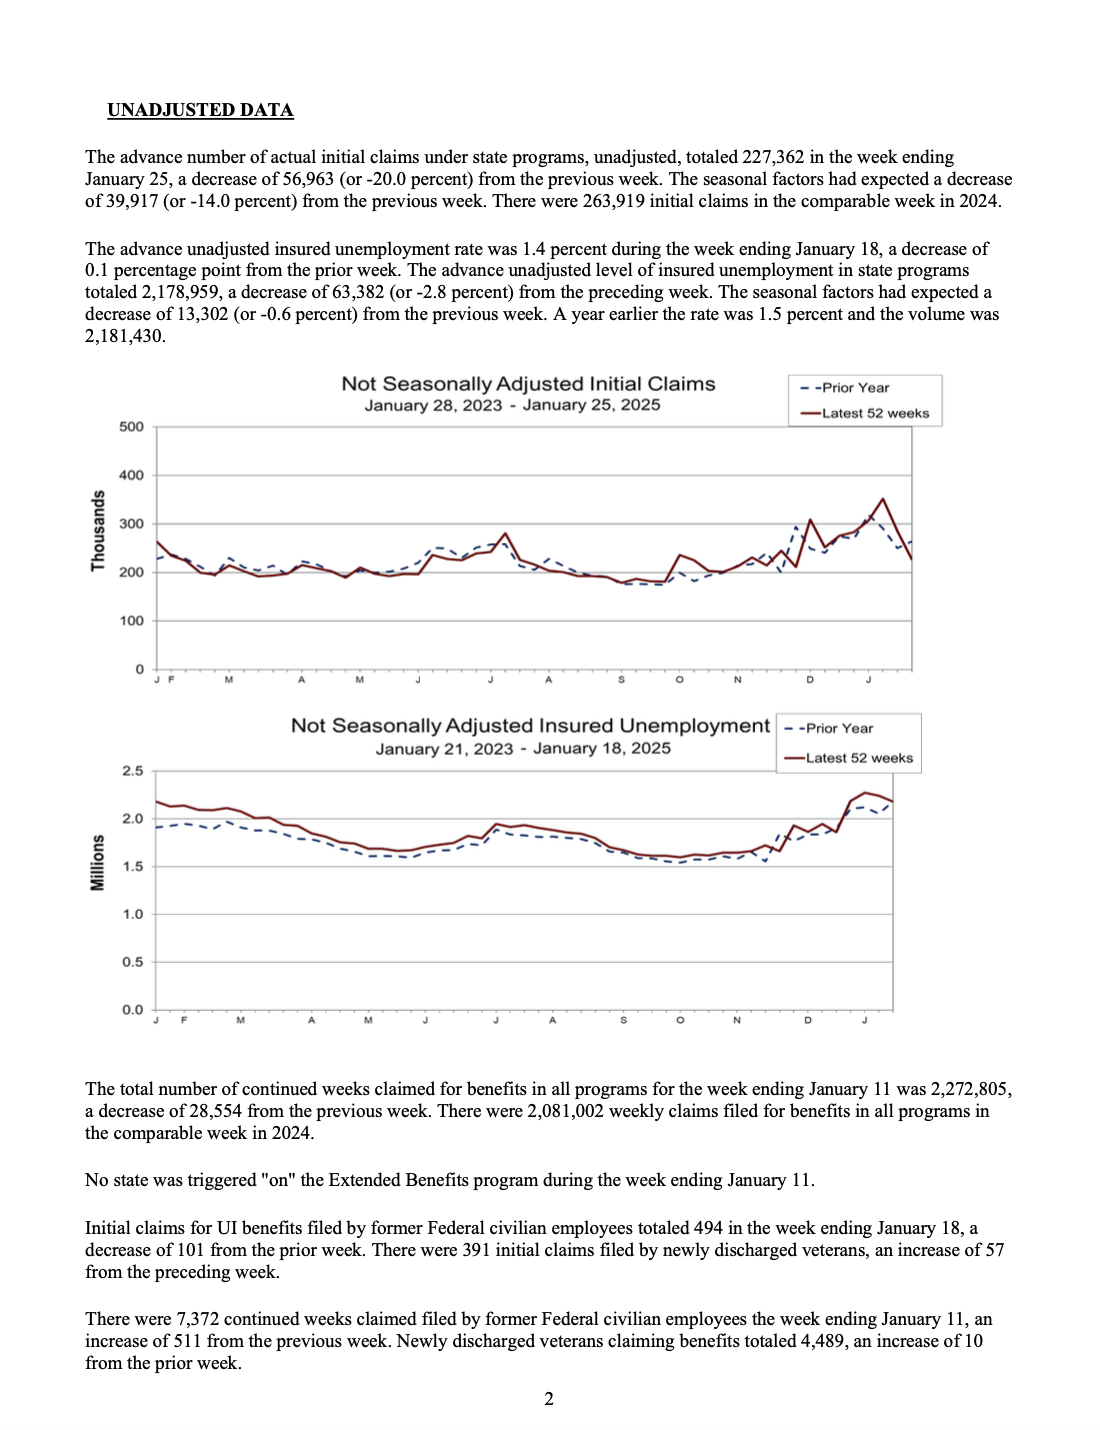
The provided document presents data on unemployment insurance weekly claims, both seasonally adjusted and unadjusted, with accompanying line graphs to illustrate trends over time. Below is a detailed analysis of the differences between the seasonally adjusted and unadjusted charts:
Seasonally Adjusted Claims (Chart 1)
- Seasonally Adjusted Initial Claims: The chart shows the number of initial claims that have been adjusted to remove the effects of seasonal variations.
- Trend Analysis:
- The line graph indicates a relatively stable trend with slight fluctuations.
- There is a noticeable dip around mid-year (around June), followed by a gradual increase towards the end of the year.
- The moving average line smooths out these fluctuations, providing a clearer view of the underlying trend.
- Key Observations:
- The seasonally adjusted data suggests a more consistent pattern compared to the unadjusted data, as it removes the distortions caused by seasonal factors.
- The overall level of initial claims appears to be lower than what might be observed without adjustment.
Unadjusted Claims (Chart 2)
- Unadjusted Initial Claims: This chart displays the raw, unadjusted number of initial claims.
- Trend Analysis:
- The unadjusted data reveals more volatility and sharp changes compared to the seasonally adjusted data.
- There is a significant drop in the number of claims during the first quarter of the year, followed by a sharp rise in the second quarter.
- The fluctuations are more pronounced, indicating the impact of seasonal factors on claim numbers.
- Key Observations:
- The unadjusted data provides a more direct representation of the actual number of claims filed each week.
- The seasonal patterns are clearly visible, showing how the number of claims can vary significantly depending on the time of year.
Comparison Between Seasonally Adjusted and Unadjusted Charts
- Volatility: The unadjusted chart exhibits higher volatility due to seasonal influences, while the seasonally adjusted chart smooths this out, making it easier to identify long-term trends.
- Trend Clarity: The seasonally adjusted chart offers a clearer picture of the underlying trend in initial claims, as it removes the noise caused by seasonal variations.
- Interpretation: The seasonally adjusted data is useful for comparing trends across different periods because it normalizes for seasonal fluctuations, whereas the unadjusted data reflects the true but potentially misleading impact of seasonal factors.
Conclusion
The seasonally adjusted charts provide a cleaner, more interpretable view of the underlying trend in unemployment insurance claims by removing the distortions caused by seasonal variations. In contrast, the unadjusted charts reveal the full impact of seasonal factors, which can obscure the true trend. For policymakers and analysts seeking to understand broader economic conditions, the seasonally adjusted data is typically preferred for its clarity and consistency. However, the unadjusted data remains valuable for understanding the immediate impact of seasonal events on claim numbers.
Run This Guide As A Notebook
Google Colab
You can run this guide as a Google Colab notebook.
GitHub
You can download this guide as a Jupyter notebook from our cookbook repo.