How to Curate Your Data with Atlas
The Atlas platform helps developers curate datasets by combining interactive data analysis with programmatic dataset access.
Common use cases for data curation include:
- Removing low-quality or irrelevant samples from your dataset
- Identifying and filtering out inappropriate or harmful content
- Cleaning up mislabeled or noisy data points
- Creating specialized subsets of your data for training ML models
Atlas visualizes your data in a data map where similar items cluster together, making it easy to spot patterns and apply bulk tagging operations. Any actions you take in the interface (like tags) are synced to the state of your data accessible through the Python SDK.
If you don't have a dataset in Atlas, visit our quickstart to learn how to get your data into Atlas for curation.
Walkthrough
We'll walk through how to identify and remove unwanted data points from your dataset using Atlas. The process involves:
- Selecting problematic data points visually
- Tagging them for removal
- Creating a new cleaned dataset without the tagged points, using the Atlas Python SDK
Select Data
The Lasso tool is a good way to easily choose which regions of data points you want to remove from your dataset.
Open the Lasso by clicking this icon:
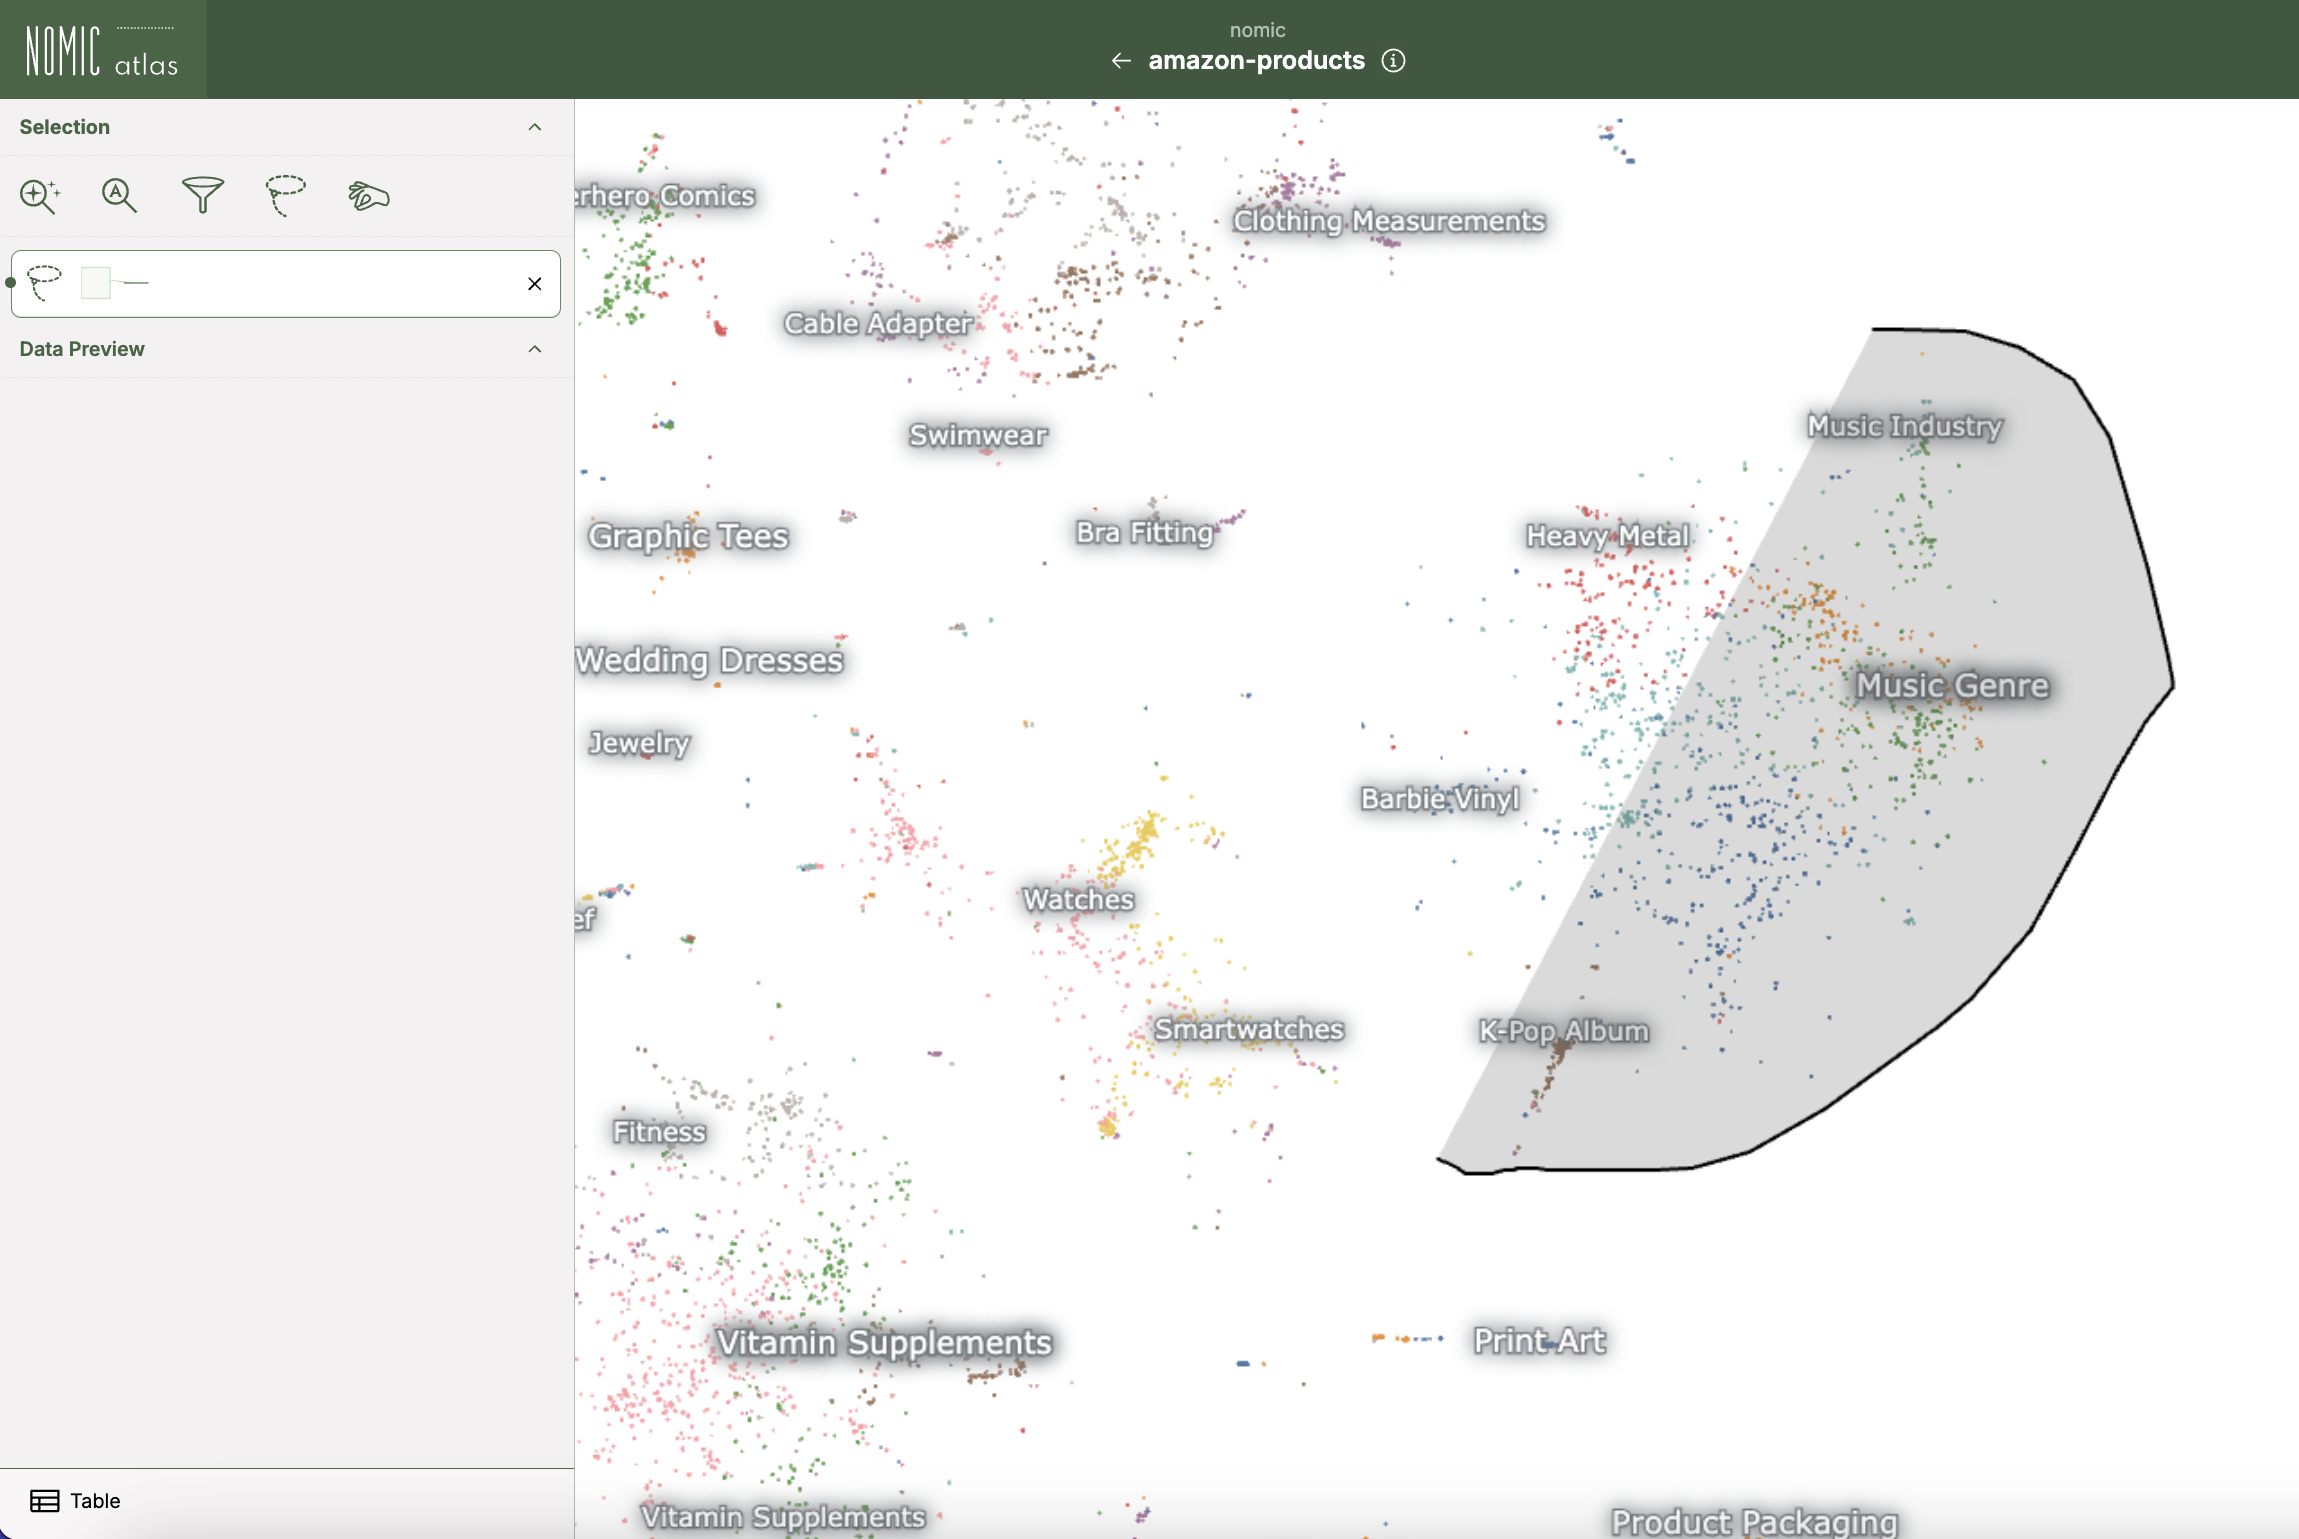
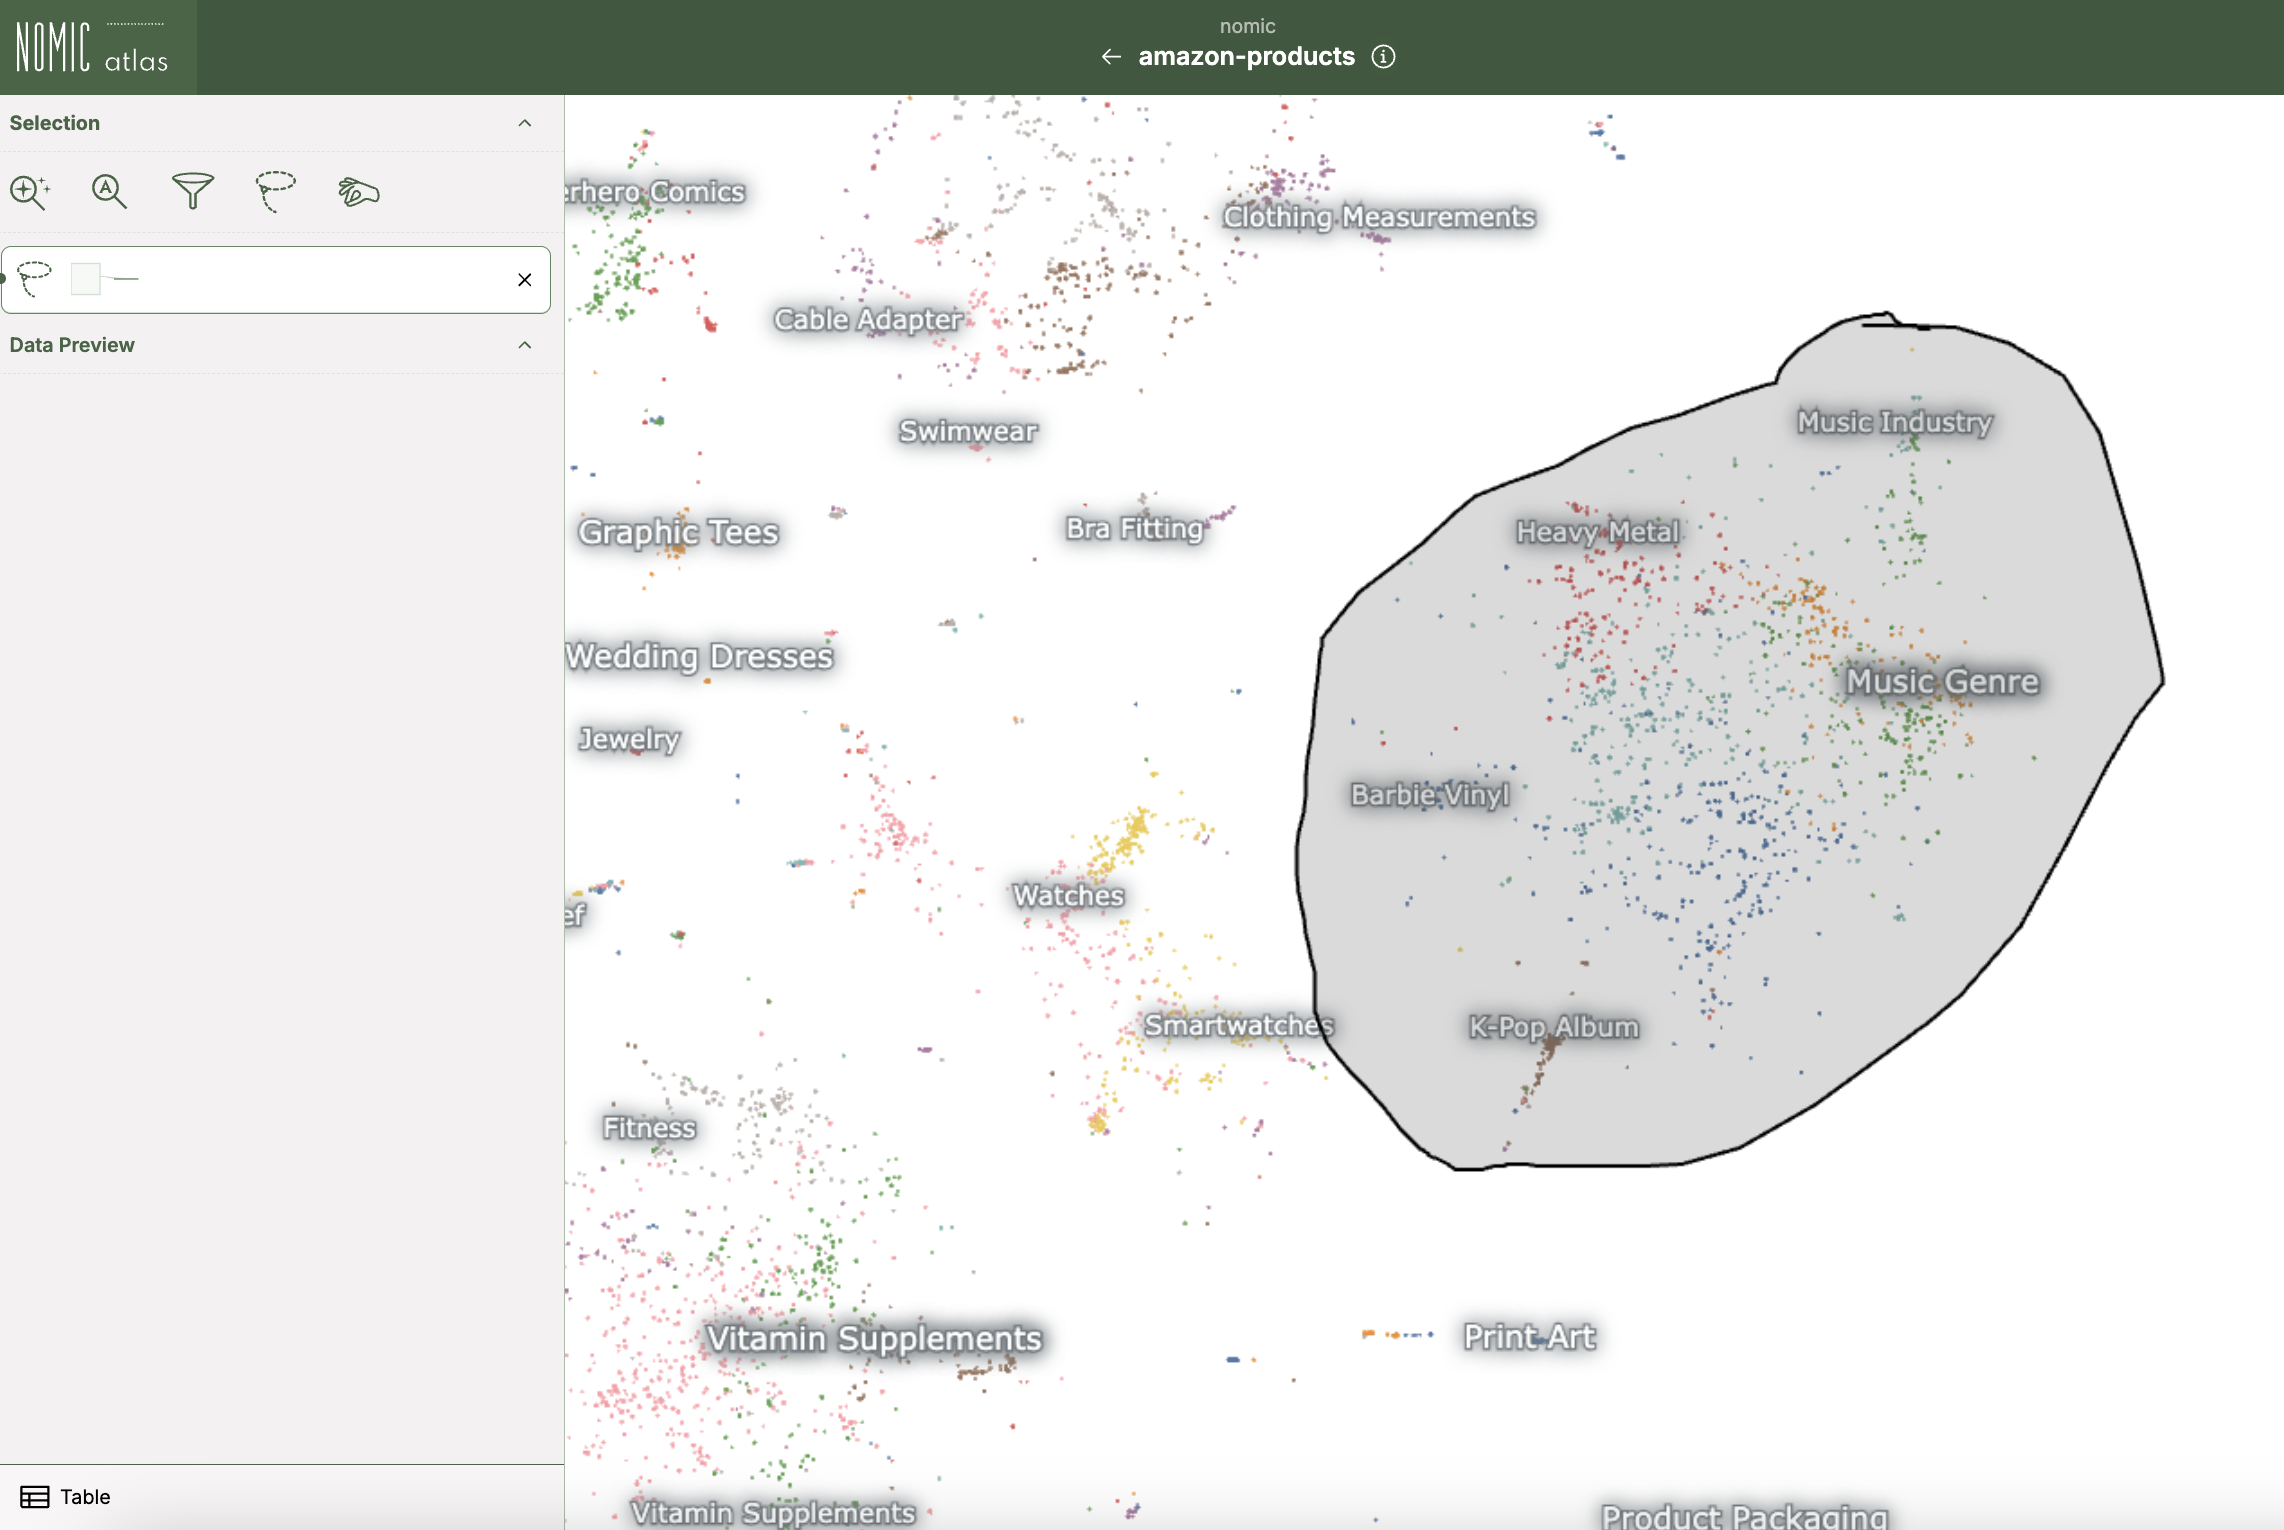
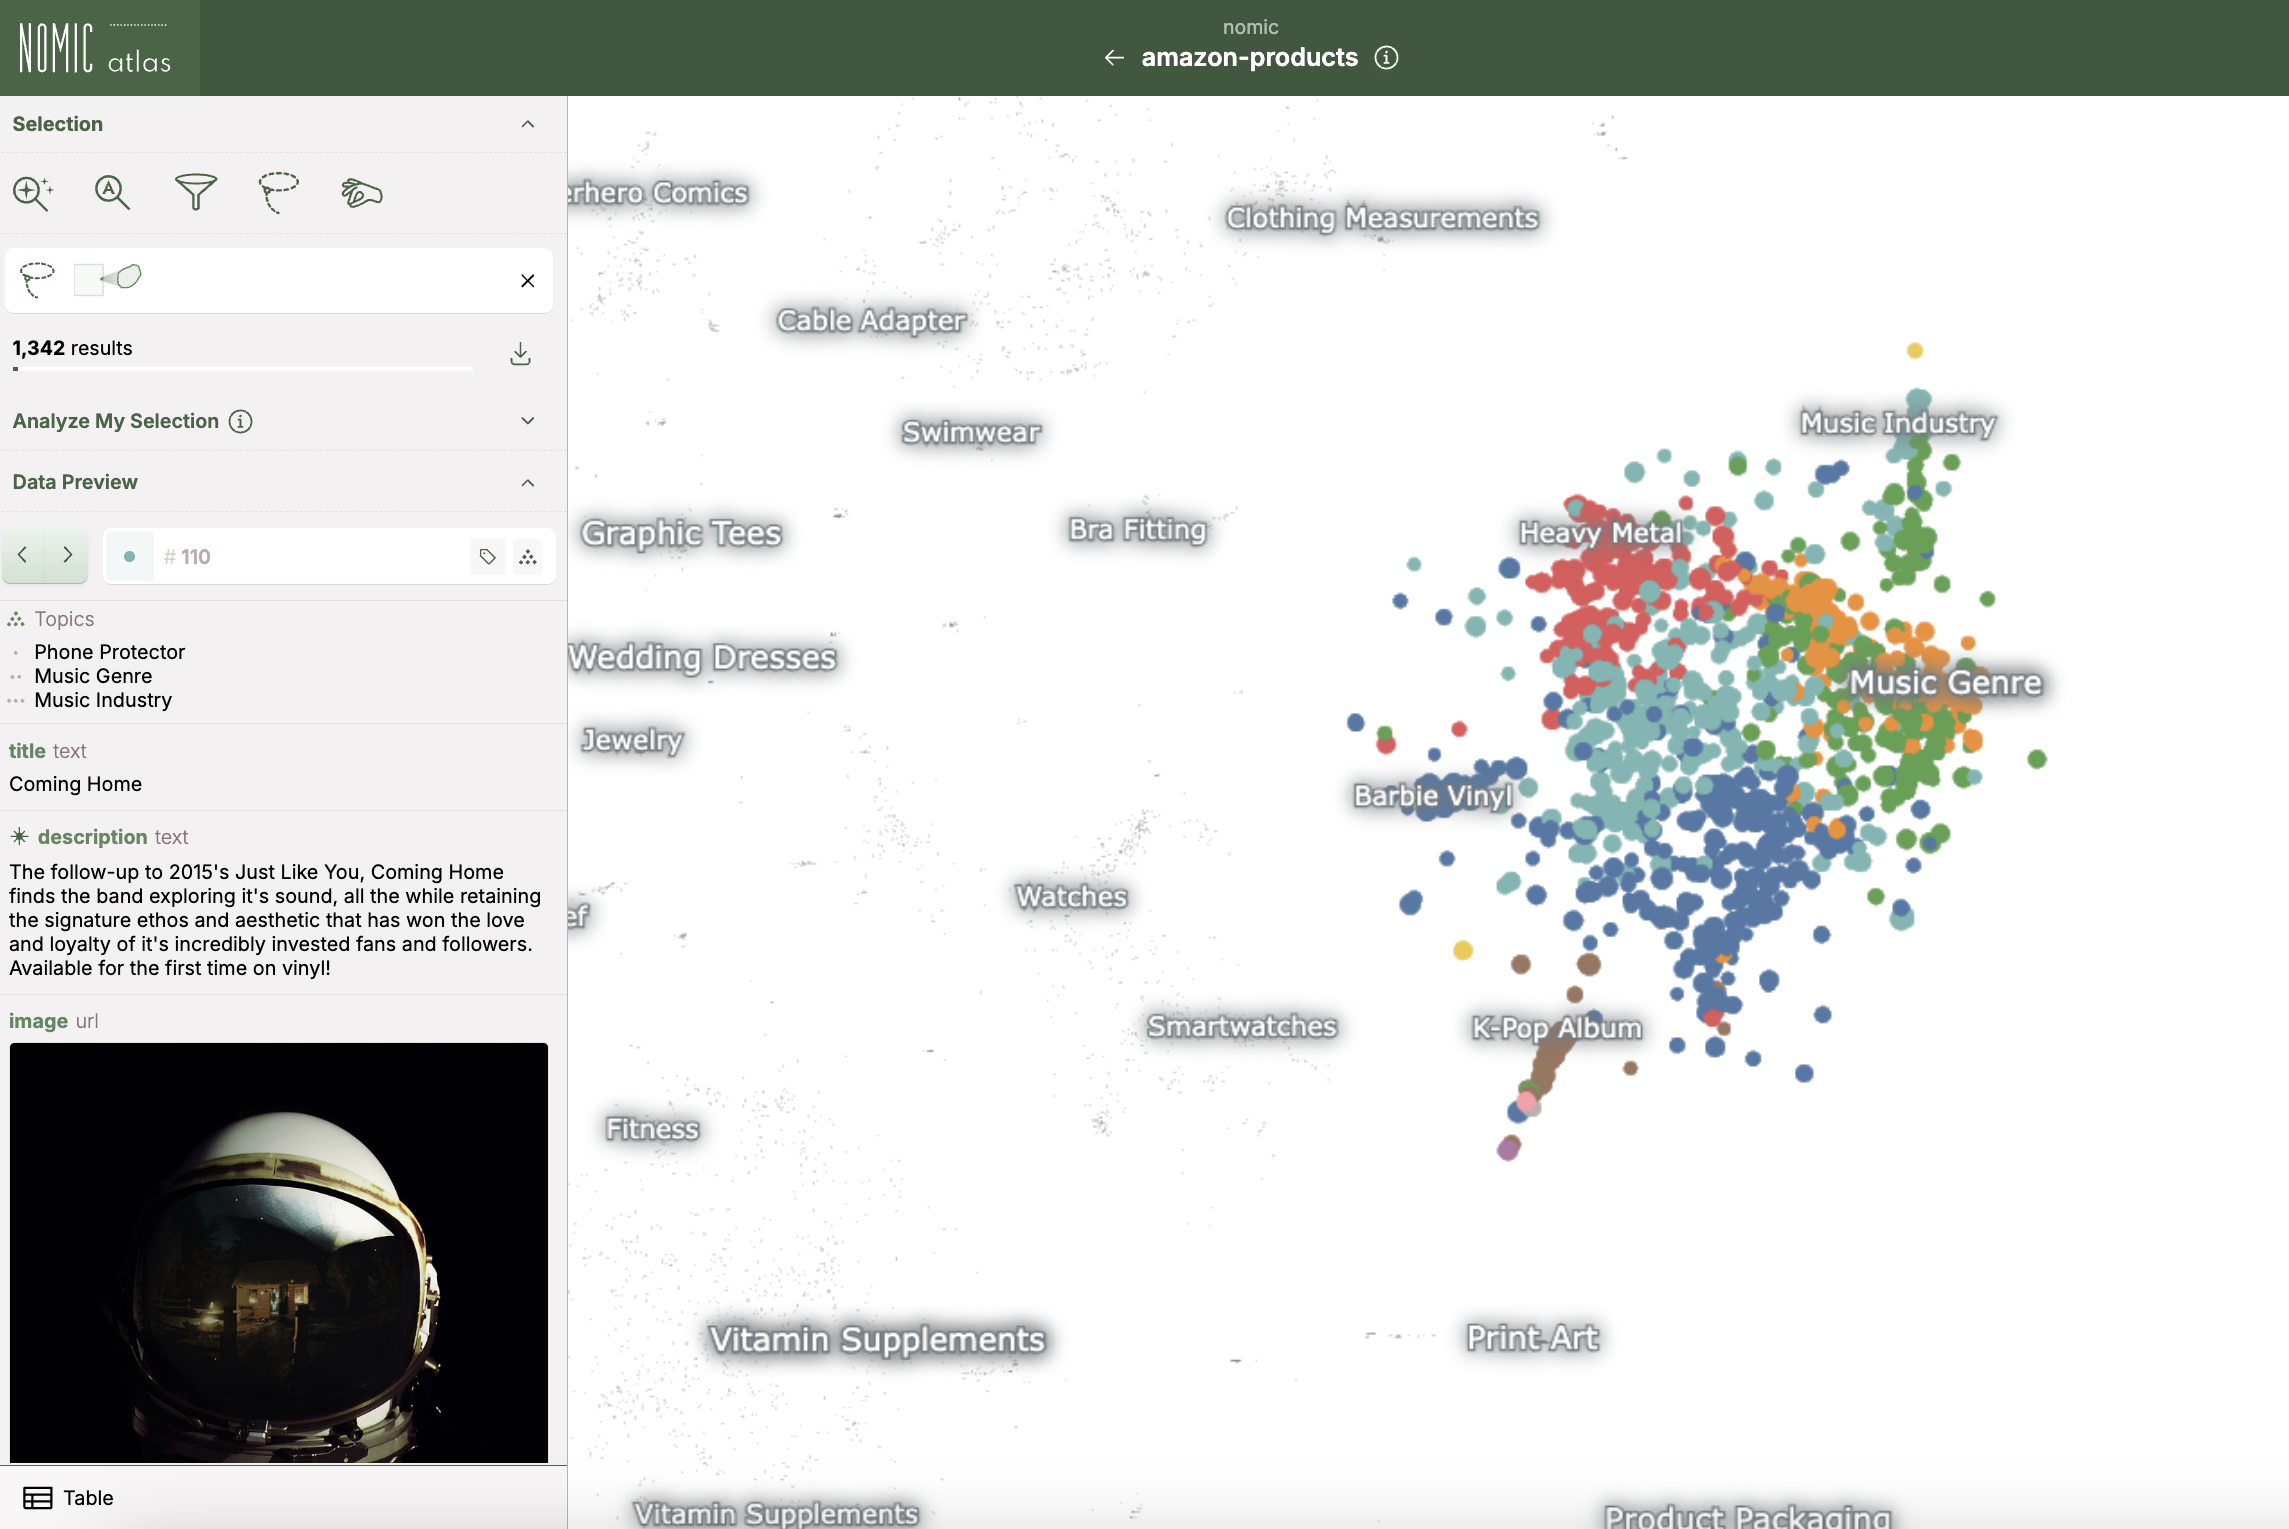
With the Lasso, circle a region of points you would like to remove, which will then create a selection with all the points inside the region you just drew:

Start drawing the lasso

Complete the lasso to select points

Selection is now active
You can combine your lasso selection with other map controls, like filters and search results, to get a more precise set of data to remove.
Tag Data
Tagging will only work if you have edit access to the map.
Once you've identified points to remove, you'll tag them to track which data points should be filtered out when creating your cleaned dataset.
To add tags to data, make sure a selection is active (not just clicking on an individual point, but creating a selection using filters/lassos/cherrypicks), and click the Tags icon in the left sidebar:
Give your tag a descriptive name (like "low-quality" or "off-topic") and hit Add to apply this tag to all the points in your selection. You can create multiple tags to track different categories of data points you want to remove.
Now here is where Atlas shines. The interaction you just did in your web browser is synced to your dataset's state, allowing you to programmatically access these tags later with the Nomic client.
Access Tags
Before creating our cleaned dataset, we need to check which points have been tagged for removal. The Atlas Python SDK makes this easy:
Make sure the Nomic client is installed to your environment:
- pip
- uv
pip install nomic
uv add nomic
Then, login to nomic with your Nomic API key. If you don't have a Nomic API key you can create one here.
- terminal
- python
nomic login nk-...
import nomic
nomic.login("nk-...")
You can fetch information about tags and tag metadata using the AtlasDataset class, which loads your dataset and the current state of your map in Python:
from nomic import AtlasDataset

dataset_identifier = "my-dataset" # for my-dataset in the organization connected to your Nomic API key
# dataset_identifier = "<ORG_NAME>/my-dataset" # for my-dataset in other organizations you are a member of

dataset = AtlasDataset(dataset_identifier)
data_map = dataset.maps[0]

# print number of points corresponding to each tag
tags = data_map.tags.get_tags()
for tag in tags:
    datum_ids = data_map.tags.get_datums_in_tag(tag['tag_name'])
    print(tag["tag_name"], "Count:", len(datum_ids))
Curate Data
Now comes the key step - creating a new, cleaned version of your dataset by filtering out the tagged points. This gives you a fresh map without the problematic data points you identified:
from nomic import AtlasDataset

dataset_identifier = "my-dataset" # for my-dataset in the organization connected to your Nomic API key
# dataset_identifier = "<ORG_NAME>/my-dataset" # for my-dataset in other organizations you are a member of

dataset = AtlasDataset(dataset_identifier)
data_map = dataset.maps[0]

tag_to_remove = "your_tag_to_remove_here"

old_df = data_map.data.df
ids_to_remove = data_map.tags.get_datums_in_tag(tag_to_remove)
new_df = old_df[~old_df.id.apply(lambda x : x in ids_to_remove)]

new_dataset = AtlasDataset(
  dataset_identifier+f"without-{tag_to_remove}",
  description=f'New map of my-dataset without the tag: {tag_to_remove}',
)

new_dataset.add_data(new_df)

new_dataset.create_index(
    indexed_field="text"
)
Now you have a new map without any of the points you tagged for removal. The positions of the rest of the points in your new map should remain largely the same.